DETECT – Land use and land cover reconstruction
While several continental regions on Earth are getting wetter, others are drying out not only in terms of precipitation but also measured by the increase or decrease in surface water, water stored in the soils, the plant root zone, and in groundwater. Observations, however, do not support a simple dry-gets-dryer and wet-gets-wetter logic and existing climate models fail to explain observed patterns of hydrological change sufficiently.
The central hypothesis of DETECT is that – next to known local effects – human land management, land and water use changes have altered the regional atmospheric circulation and related water transports. These changes in the water balance’s spatial patterns have, it is hypothesized, created and amplified imbalances that lead to excessive drying or wetting in more remote regions.
The remote sensing group contributes to DETECT in the project B03 “Deep learning for satellite-based land use and land cover reconstruction”. The goal of this project is the determination of land use and land cover from optical satellite data for specific points in time (as a snapshot) or for longer periods of time (e.g. one season). For this purpose, deep neural networks will be developed that take into account the specific biogeographical characteristics of the regions of interest in order to ensure a high generalization capability. Furthermore, spatiotemporal data gaps will be closed to improve the data basis for the developed methods and data and model uncertainties for the derived land use and land cover maps will be determined.
Associated researcher:
Johannes Leonhardt
Research partners:
DETECT
Funding:
Deutsche Forschungsgemeinschaft (DFG) – SFB 1502/1-2022 Project number 450058266
AID4Crops – IP5: Uncertainty meets Explainability: Combining Uncertainty Quantification and Explainable Machine Learning for Crop Monitoring
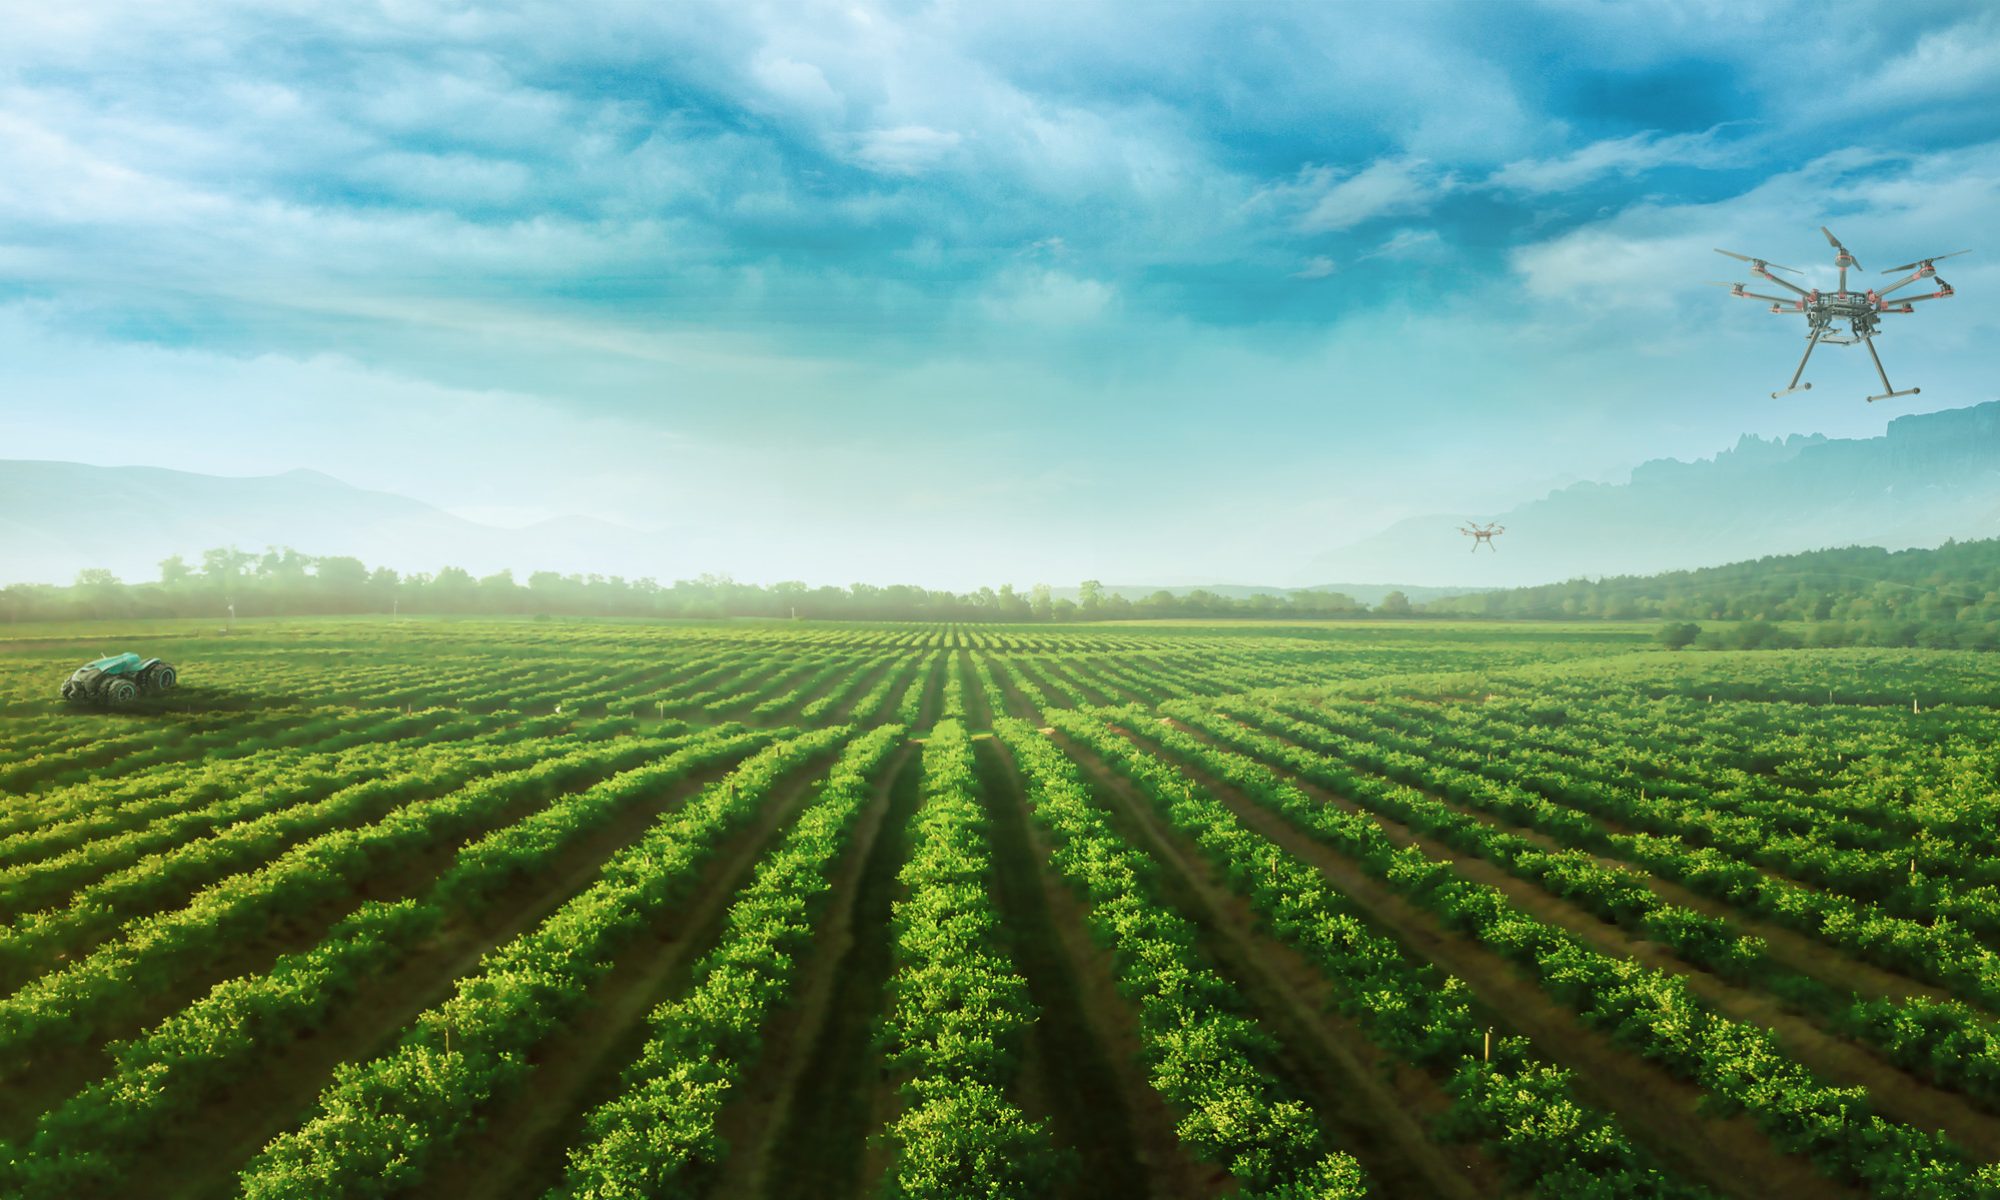
With the escalating requests for food security as a global aim, precision agriculture emerged as an important key player to enable sustainable agriculture systems. Monitoring and sensing can provide data-driven optimized decisions to enhance the agricultural management decisions.
The central tentative assumption which motivates AID4Crops research unit is that coupling sensing and decision making would lead to more beneficial insights for both researchers of AI-based sensing algorithms and automated forecasting techniques.
IP5 is a pivotal project to AID4Crops, as our contributions would be serving other themes and enriching them with insights that would answer two vital questions:
1. What should be sensed?
2. How robust is the prediction it when it comes automated decision-making?
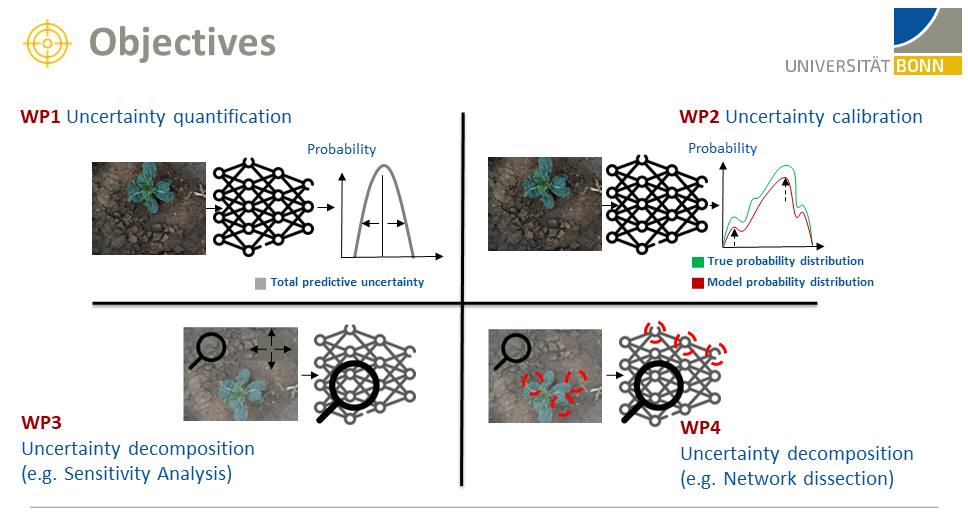
Our primary focus lies in utilizing Uncertainty Quantification (UQ) techniques to augment Deep Learning models’ predictions, thereby achieving safe and trustworthy systems. Furthermore, Explainability, being a crucial necessity to comprehend the aforementioned outputs, would provide insights into the reasons behind such decisions. Merging both would complement each one of them which would provide more reliable and understandable predictions.
Associated researcher:
Mohamed Farag
Research partners:
AID4Crops research unit: Chris McCool, Maren Bennewitz, Cyrill Stachniss, Jürgen Gall, Eike Lüdeling
Funding:
Deutsche Forschungsgemeinschaft (DFG) – Project number 459376902
TrAgS – Tracking the use and adoption of agricultural technologies through satellite remote sensing and self-supervised deep learning
Novel technologies and farm management systems are considered to be crucial to increase agriculture’s sustainability and resource use efficiency. However, our data sources that provide information on what technologies are actually being used on farms are very limited. This makes it difficult to assess if technologies can indeed realize their promised environmental effects and also limits our possibilities to study and understand technology diffusion processes.
Satellite data and novel deep learning approaches offer currently unused opportunities that can help to overcome those data limitations. So far, however, those datasets are not fully exploited to study adoption behavior or diffusion processes. Further, although the existing data products offer substantial opportunities, they remain limited in terms of the regions/technologies they cover. Extending to other regions/technologies is limited because learning new machine learning models or extending existing models requires large amounts of labeled reference data (i.e., observations with known reference information) that are often lacking. The aims of this project are therefore twofold.
1) First, we aim to exploit data products derived from satellite data to study diffusion processes, particularly adoption (disadoption) dynamics and spatially mediated peer effects.
2) Secondly, we aim to significantly reduce the number of needed labeled reference data for deep learning approaches when extending the approach to other regions/technologies.
Associated researcher:
Jana Kierdorf
Timo Stomberg
Research partners:
Hugo Storm and Alexa Leyens
Funding:
Deutsche Forschungsgemeinschaft (DFG) – Project number 504991777
Finished projects
PhenoRob – Plant Growth Modeling
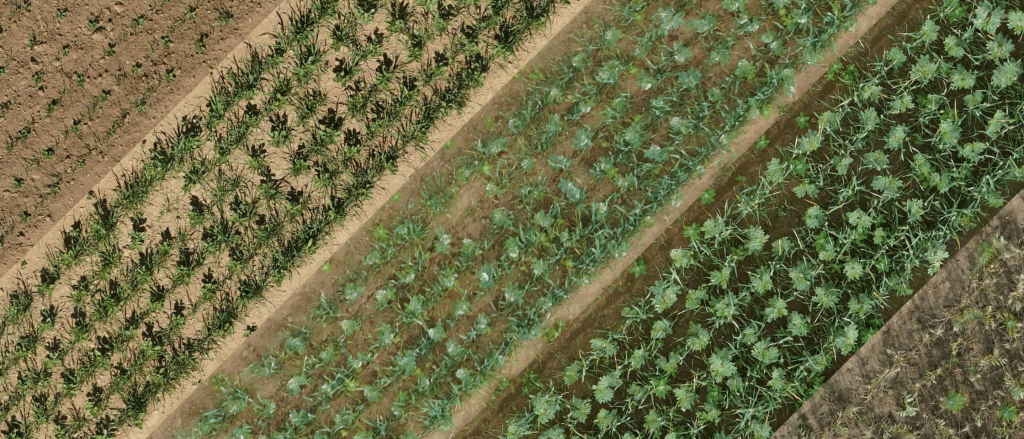
Plant growth modeling is of crucial importance for wide areas of agriculture, biology and breeding. Our goal is to develop image-based growth models that, for example, represent future phenotypes of a plant on an image. We are working on making these images look as close as possible to real sensor data, on the basis of which further analyses can be carried out. In addition, we aim to include other growth influencing factors, such as seed density, irrigation, fertilization, mixed cropping environment (as in the picture), to ultimately enable image-based growth simulations. Methodically, our models are based on generative adversarial networks and transformer architectures.
Associated researcher:
Lukas Drees
Research partners:
PhenoRob
ZALF
TUM – Computer Vision Research Group
EDDY – Multi-Modal Neural Networks for Identification, Tracking and Classification of Ocean Eddies
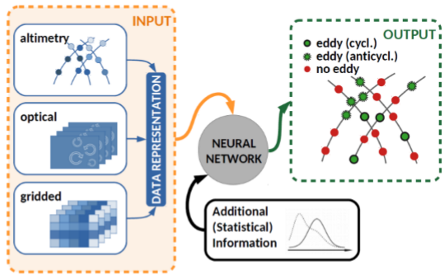
The detection of mesoscale ocean eddies, the ‘weather of the ocean’, is one example of a possible application on Multi-Modal Neural Networks. They transport water mass, heat, salt and carbon and have been identified as hot spots of biological activitiy. Monitoring eddies is therefore of interest among others to marine biologists and to fishery. The identification and tracking of eddies are challenging due to their spatio-temporal dynamic behaviour and so far has been treated as isolated tasks rather than a joint task which can lead to suboptimal overall results. In our research, we use the current advances in the deep learning area in order to develop a state-of-the-art multi-modal neural network and tackle this challenge by joining the tasks of identification and tracking into one.
Associated researcher:
Eike Bolmer
Research partners:
Prof. Dr.-Ing. Jürgen Kusche, University of Bonn
PD Dr.-Ing. habil. Luciana Fenoglio-Marc, University of Bonn
Dr. Adili Abulaitijiang, Technical University of Denmark
Dr. Sophie Stolzenberger, University of Bonn
OPTIKO – Optimization of cauliflower cultivation by monitoring with UAVs and machine learning
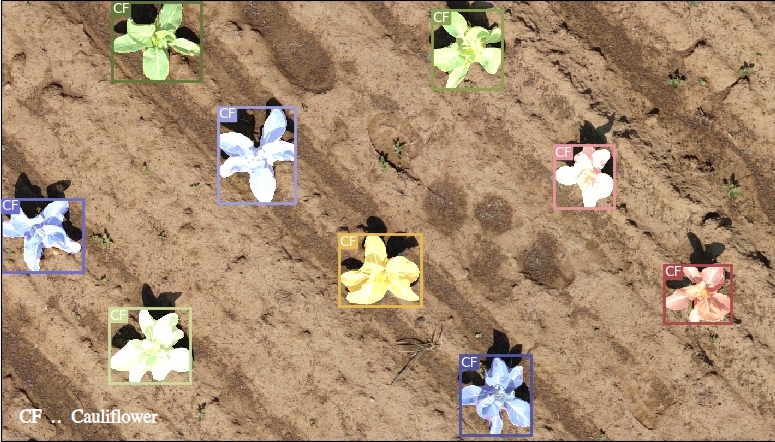
In the project OPTIKO, we deal with the optimization of cauliflower cultivation using image-based Unmanned Aerial Vehicle (UAV) data and its automatic analysis by means of machine learning (ML) methods. Our overall goal is to analyze the development and growth of cauliflower to support the farmers’ decision-making.
Cauliflower is a high-value crop that needs to fulfill high-quality criteria. It could be called the diva of crops. Each plant develops differently, which makes harvest estimation difficult. Typically, farmers and agricultural advisors monitor fields regularly through spot checks of individual plants but they do not get an overview of the whole field. Also, abiotic and biotic stress factors must be monitored throughout the growing season to ensure healthy growth. For monitoring entire fields, remote sensing can help.
Harvesting of the cauliflower heads (known from the supermarket) is done by hand due to the great variability in the development of the plants. Since the cauliflower head is not visible due to the leaf canopy, each plant must be touched by hand to determine the size of the head, making it difficult to estimate when to harvest. For sales reasons, each cauliflower must be harvested within about one week, when the heads are of sufficient size but not yet overripe. Thus, several passes over the field are necessary which increases the labor intensity and is, therefore, more costly for farmers.
In the project, the entire growing period of different cauliflower fields is visually surveyed using RGB and multi-spectral UAV images. Additionally, we georeference the data so that we can derive a georeferenced coordinate as well as time series for each individual plant from the images. ML helps us to detect the plants and determine their phenotypic traits like the developmental stage as well as plant and cauliflower size. Furthermore, ML supports identifying stresses automatically throughout the field and helping the farmer to optimize fertilization and pesticide use. Also, the estimation of harvest window and cauliflower head size supports the farmer in decision-making and facilitates his work.
Associated researcher:
Jana Kierdorf
Research partners:
Forschungszentrum Jülich
JB Hyperspectral Devices UG
Schwarz Gemüse- & Erdbeerbau
KI:STE and MapInWild: Exploring Wilderness Using Explainable Machine Learning in Satellite Imagery
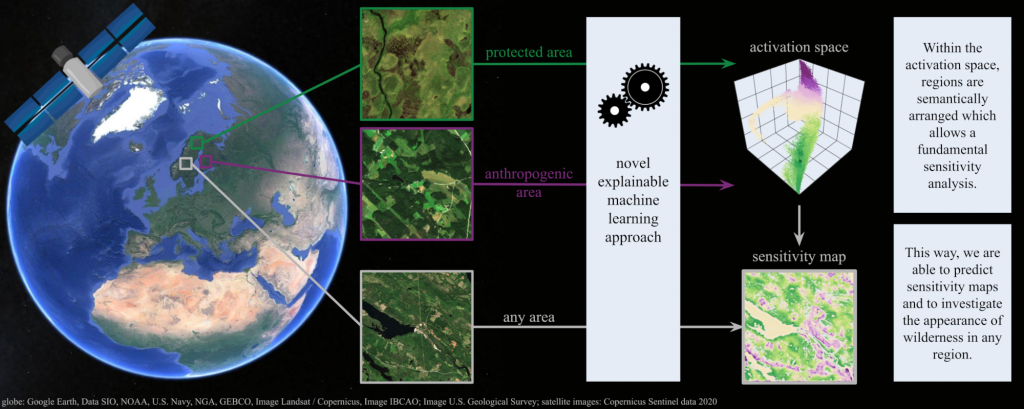
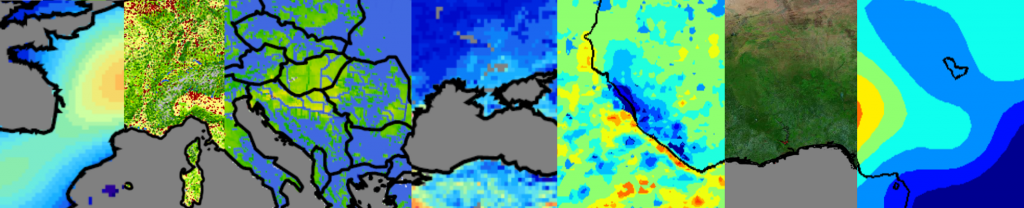
Natural areas offer important ecological and social benefits, and therefore warrant monitoring and preservation. We explore the characteristics and appearance of natural places via multispectral satellite imagery. For this, we apply a novel explainable machine learning technique on a curated dataset, containing Sentinel-2 images of areas representing 1) protected areas with the aim of preserving and retaining the natural character and 2) anthropogenic areas consisting of artificial and agricultural landscapes.
With our technique, we predict continuous, detailed and high-resolution naturalness maps. Our neural network provides an interpretable feature space in which regions are semantically arranged. This increases confidence in the method and allows for new explanations in regards to the investigated concept. In doing so, our model advances explainable machine learning for remote sensing, offers opportunities for comprehensive analyses of existing wilderness, and practical relevance for conservation efforts.
Associated researcher:
Timo Stomberg
Ahmed Emam
Research partners:
Immanuel Weber
Prof. Dr.-Ing. Michael Schmitt, Technical University of Munich
KI:STE: AI Strategy for Earth System Data
Funding:
Deutsche Forschungsgemeinschaft (DFG) – Project number 458156377
German Federal Ministry for the Environment, Nature Conservation and Nuclear Safety – Grant number 67KI2043